- Notice
- Notice of Kansai Conference
Sudden attack! Participating Schools Nearby! vol.1 Osaka Prefectural Sakaihigashi High School
2014.12.08
Hello! I am Domeki (Domeki) from Libanes Osaka!
Visit schools participating in the Castle and ask them about their research and their enthusiasm for the Castle
'A Strike! Participating schools next door!" was launched (somewhat on its own)!
We will also summarize the key points of the presentation that can be applied to other schools, so please take a look!
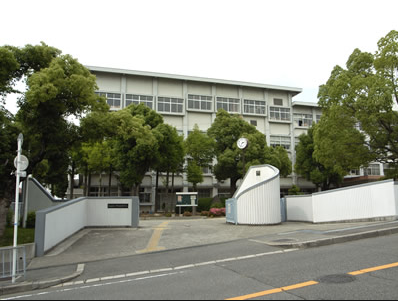
The first commemorative event is Osaka Prefectural Sakaihigashi High School.
Oral and poster presentations will be given.
Click here to see the presentation!
11:40 Research on the relationship between rainwater composition and regional airflow ( Osaka Prefectural Sakai-Higashi High School Geography Club )
The Earth Science Club of Sakai Higashi High School in Osaka Prefecture has been conducting a rainwater study for the past eight years. In addition to investigating acidity and conductivity, the research includes using a spectrophotometer to measure the concentration of ions (sulfate, nitric acid, chloride, calcium, and ammonium) in rainwater. In this study, we will examine the pathways by which these ions were transported using wind direction and stream line analysis of airflow around the school.
I specialize in plant research, and weather is not my area of expertise, but the key phrase "acid rain" is memorable!
I look forward to seeing what kind of research you do.
What is a streamline?
For acid rain, ever in Castle,Ritsumeikan Keisho Junior High SchoolIt is also presented in
In this issue, the "8 yearsWhat kind of data will pop up in the "continuing research of the
When I headed to the school, I found that many members of the club had gathered there despite the testing period.
We then listened to poster presentations and rehearsed our oral presentations.
I can't reveal the details of the research here yet,
The data on airflow and analysis of composition provide insight into where the causative agents of acid rain come from.
alsoThe results of the 8-year study are significant.
However, because it was too large, there were too many figures and tables, and I had the impression that the relevance of the data was a little difficult to understand as a whole.
A unique feature of this year's conference is that it is a "cross-disciplinary conference.
Students come from various fields such as biology, geology, physics, chemistry, information science, engineering, and so on.
In other words, it is necessary to communicate research content in a way that is easily understood by non-specialists.
With this in mind, the key is an easy-to-understand overall research story.
Background: We have been aware of ●● but not of ◯◯, so we focused on that.
Hypothesis: "Fatty" can be understood if "◯◯" is △△△.
Research plan: We used the Disappointment method in order to do △△△.
Result: When we dismounted, we got a result of □□□.
Discussion: From the result of □□□, ■■ is considered. From ■■, ◯◯ was considered in this way.
Try to draw a connected path from background to discussion, such as
For example, I understand the desire to present a lot of data,
There is only so much that can be conveyed in a 10-minute presentation.
I advised him to take the plunge and try to reduce the number of data presented.
Of course, bring a printout of the data you have compiled and other information to respond to questions,
I think you should be able to show them!
Above! Japanese barberry (Berberis thunbergii)
Summary of points
(1) Clarify the story from hypothesis to discussion.
(2) After clarifying what you want to convey, drastically reduce the amount of data that can be omitted.
